
We can only perceive a small fraction of the total energy emitted by objects around us because our eyes can only detect the visible range of the electromagnetic spectrum. While this visible range allows us to see colors, it can sometimes be limiting.
For instance, consider two satellite images taken at different times of the same mountainous region.
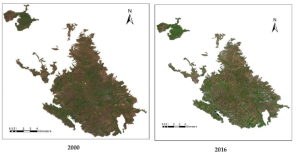
A visual inspection might lead us to conclude that the region has vegetation due to the green color. However, distinguishing between vegetation types and detecting changes over two years is challenging. This is primarily because different vegetation types have almost similar reflectance in the visible range of the electromagnetic spectrum, as plants generally reflect green light.
Beyond the visible range, however, vegetation types exhibit different reflectance characteristics. Therefore, in this example, using the reflectance properties of vegetation outside the visible range allows us to classify different tree species and examine changes over time. This information helps us understand the diversity and changes in vegetation distribution on the map more comprehensively.
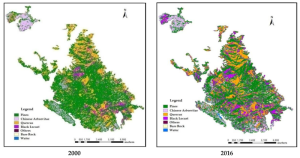
The above example highlights the advantages of seeing beyond the visible spectrum. Fortunately, we don’t have to rely solely on our eyes to gain this advantage.
Some satellite sensors have the capability to detect both visible and invisible parts of the electromagnetic spectrum. These sensors are known as multispectral or hyperspectral sensors, and the images they produce are referred to as multispectral or hyperspectral images. This technology enables us to obtain more detailed and comprehensive data in various fields, such as vegetation, water quality, and soil properties.
What is a Multispectral Image?
Multispectral images contain multiple bands of the electromagnetic spectrum. These bands are collected by sensors that measure the energy reflected in specific regions of the spectrum.
Most multispectral images include 4 to 12 bands within the visible and especially the infrared parts of the electromagnetic spectrum. According to USGS reports, multispectral images can have a wide spectral range, including up to 36 wavelength bands.
These images can be observed either as monochromatic images in a single band or as color composites created by combining multiple bands.
A Quick Look at the Electromagnetic Spectrum
The electromagnetic spectrum covers the entire range of electromagnetic radiation wavelengths. For analytical purposes, the spectrum is usually divided into different bands representing wavelength ranges. These bands are often referred to by names, such as gamma rays, X-rays, ultraviolet rays, visible light (0.4μm – 0.7μm), infrared (0.7μm – 100μm), microwaves (1mm – 1m), and radio waves.
The visible part, which we perceive with our eyes, is typically divided into blue, green, and red. Similarly, the infrared band is divided into near-infrared, mid-infrared, and far-infrared regions. These divisions help us understand the types and properties of radiation in different bands of the electromagnetic spectrum.

Different regions of the spectrum are used to provide information about various features on the Earth’s surface. However, to determine which bands to use, we first need to understand spectral signatures.
What Do We Mean by Spectral Signature?
A spectral signature refers to the amount of energy reflected by an object in different parts of the electromagnetic spectrum. These signatures are typically represented as a graph showing the variation in reflected energy at different wavelengths, known as a spectral response curve.
The following graph presents an example of a spectral response curve that shows the spectral signatures of various objects.
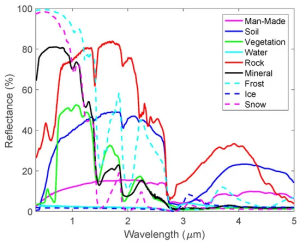
Moreover, a spectral signature of an object is not constant. It can vary depending on the material’s physical properties, atmospheric effects, and the sensor’s viewing angle. Therefore, spectral response curves are sometimes drawn using shading rather than a thin line to indicate variability.
Why Are Spectral Signatures Important in Remote Sensing?
Spectral signatures are a crucial tool for identifying various objects in remotely sensed images.
For instance, from the spectral response curve above, we can infer the following:
– Vegetation is characterized by higher reflection in the green part of the visible spectrum and the highest reflectance in the near-infrared band.
-Bare soil shows a gradual increase in reflectance across the visible and near-infrared bands.
– Water has lower reflectance compared to vegetation and soil, particularly in the visible spectrum.
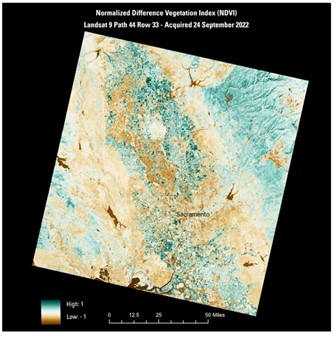
Understanding these spectral response characteristics makes it easier to identify objects in remote sensing data. Additionally, examining spectral response properties contributes to developing indices used for measuring various features. For example, the Normalized Difference Vegetation Index (NDVI), used to identify and assess vegetation areas, makes spectral information more meaningful. The powerful multispectral sensors of Pleiades Neo can be an effective tool for such analyses and are available at uydushop.com.tr.
What is a Hyperspectral Image?
Hyperspectral images contain hundreds of narrow, contiguous wavelength bands across the visible and infrared regions of the electromagnetic spectrum. The USGS defines hyperspectral images as those containing 37 or more bands.
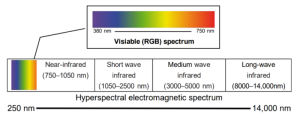
The advantage of hyperspectral remote sensing lies in obtaining an almost continuous reflection spectrum for each pixel in an image. This allows for the detection of small differences in features that would otherwise be undetectable with multispectral images, thanks to the use of narrow wavelength bands.
Therefore, hyperspectral images provide advanced capabilities for identifying and quantitatively assessing the physical and chemical properties of objects of interest, such as vegetation, water, soil, minerals, etc.
Examples of Hyperspectral Satellites
The table below includes examples of hyperspectral sensors, detailing the number of bands, sample colors, and resolution:
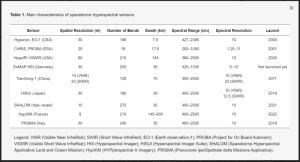
Update to the table above: The EnMAP satellite was successfully launched on April 1, 2022.
What is the Difference Between Multispectral and Hyperspectral Images?
The major difference between multispectral and hyperspectral images is the number of bands in the same part of the electromagnetic spectrum.

The number of multispectral bands (above) compared to the number of hyperspectral bands (below) in the same part of the electromagnetic spectrum.
The table below summarizes the differences.

What Are Multispectral Images Used For and Where Do Hyperspectral Images Come Into Play?
Multispectral images are useful for distinguishing between vegetation types, soils, water bodies, and man-made structures. Hyperspectral images, with their higher spectral resolutions, offer the ability to discern features in finer detail. They particularly excel in revealing spectral details that multispectral sensors cannot detect.
In this section, we focus on the applications of multispectral imagery and discuss where hyperspectral imagery can be effective. To highlight the significance of various regions of the electromagnetic spectrum, we summarize those suitable for each application.
We categorize applications based on areas of interest such as vegetation, soil, water, and rocks/minerals.
Vegetation Applications
When light hits vegetation, various phenomena like reflection, absorption, or transmission occur. These interactions arise from the chemical, structural, and biological properties of plants, allowing us to understand plant characteristics.
In summary:
– Healthy plants absorb ultraviolet light (100-400 nm).
– Vegetation appears green because it reflects the green portion of the visible electromagnetic spectrum; however, it absorbs visible red and blue portions.
– Leaf pigments, especially chlorophyll, influence reflection in the visible range (400-700 nm).
– Leaf cell structure affects reflection in the near-infrared region (700-1000 nm).
– Plant water content and biochemistry (e.g., protein and cellulose content) influence reflection in the short-wave infrared region (1000-2500 nm).
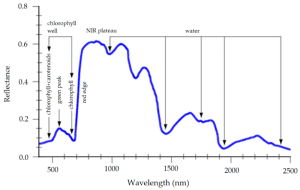
The spectral response characteristics mentioned above aid in the development of vegetation indices that are useful for extracting vegetation properties from multispectral and hyperspectral data. Additionally, they lead to the following multispectral and hyperspectral imaging applications for vegetation analysis.
Multispectral Imaging for Vegetation Type Classification
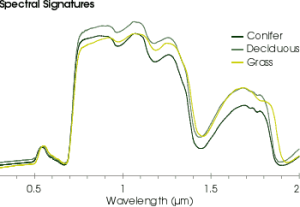
Spectral response patterns vary among different plant species and enable the recognition of species through the use of remotely sensed imagery.
For example, the graph below illustrates the spectral response patterns of coniferous, deciduous, and grass vegetation types. While their reflections in the visible range are almost identical, they exhibit different reflection patterns in the near-infrared range, allowing for classification based on these patterns.
Detection of Plant Health and Stress Using Multispectral Images
For vegetation, the rate of increase in reflectance is highest in the region between the visible red and near-infrared bands, known as the red-edge.
The red-edge band is a significant indicator of plant health and stress.
How does it work?
An unhealthy or stressed plant produces less chlorophyll. Less chlorophyll results in higher reflectance in the visible red region (chlorophyll primarily absorbs visible radiation, especially in the blue and red wavelengths). Additionally, as the water content in the leaves decreases, reflectance increases in the near-infrared region. These changes alter the position and shape of the red-edge band.
For example, the image below illustrates changes in the shape and position of the red-edge band for plants experiencing three different levels of water stress.
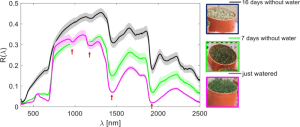
Learn how to leverage the red-edge band to detect vegetation stress at the beginning of the plant growth cycle.
Where Do Hyperspectral Images Come Into Play?
Hyperspectral images contain more detailed spectral features than multispectral images, providing comprehensive information about the subtle characteristics of vegetation. Therefore, hyperspectral images are useful for distinguishing between plant species, detecting vegetation stress, and even predicting biomass in more detail.
Additionally, in some cases, vegetation indices created using the narrow bands of hyperspectral images provide better estimations of biophysical parameters compared to indices derived from multispectral images; for example, biomass and leaf area index.
Soil Applications
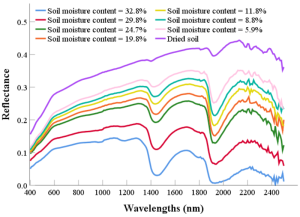
The spectral reflectance of soils varies depending on their physical and chemical properties. These interactions allow for the application of multispectral data to assess soil properties such as moisture content, organic matter content, iron content, texture, roughness, and mineral composition.
Using Multispectral Images for Soil Moisture Estimation
Soil moisture estimation is crucial in many fields such as agriculture, hydrological studies, and carbon cycle research.
Changes in soil reflectance decrease as the moisture content increases up to the saturation point in the visible wavelengths. Similarly, soil reflectance in the near-infrared region decreases with increasing moisture content. These reflectance characteristics enable the estimation of soil moisture using multispectral bands.
Determining Soil Organic Matter Content Using Multispectral Images
Determining soil organic matter content is crucial for soil management, estimating available nutrients for precision agriculture, and climate variability studies.
Research has shown that the spectral reflectance properties of soils in different multispectral bands can be used to estimate soil organic matter content. For instance, even a slight increase in organic matter (amounts exceeding just 2%) has a significant impact on soil reflectance. Specifically, organic matter reduces overall soil reflectance by up to 5%, with further changes resulting in more pronounced alterations.
Water Applications
Water reflects only about 10% of incoming energy, with most of these reflections occurring in the visible portion of the electromagnetic spectrum and minimal to no reflection in the near-infrared region.
However, water bodies exhibit unique reflective properties depending on factors such as properties of water, depth, suspended sediments, and aquatic vegetation. Therefore, multispectral images are valuable in examining these variable aquatic environments.
Determining water quality is also an application area.
Water quality is assessed using various indicators including dissolved minerals, suspended matter, bacterial levels, oxygen levels, salinity, etc. These indicators become prominent in the visible and near-infrared regions of the electromagnetic spectrum, allowing remote sensing techniques to be employed in identifying these features.
Mining Applications
Various rocks and minerals are found on the Earth’s surface, each exhibiting unique reflective properties based on characteristics such as color, texture, and chemical composition.
Multispectral images play a critical role in mineral exploration processes, enabling the differentiation and mapping of different rocks and minerals based on reflections in the visible and infrared regions of the spectrum.
Beyond mineral exploration, multispectral images also facilitate environmental monitoring of mining sites. You can explore how geoinformation technology enables mining operators to support environmental sustainability and improvement planning throughout the mining lifecycle.
Where Do Hyperspectral Images Come Into Play?
Due to their wide spectral bands, multispectral images are limited in the detailed classification of rocks and minerals; however, you can estimate the distribution of mineral components within a pixel.
However, using hyperspectral images with fine spectral resolution allows for the identification of a wide range of minerals and enables determination of their compositions and abundances.
Go Beyond the Visible: Explore the Entire Spectrum
The human eye can only perceive the visible portion of the electromagnetic spectrum. However, remote sensing systems offer the ability to measure beyond the visible and across the entire spectrum.
Multispectral and hyperspectral images provide in-depth insights into our changing world, transcending the limits of human experience. These images offer information on various topics such as soil mineral composition, biomass and plant health, surface roughness, vegetation types, ocean temperatures, and much more.
To sum up advancements in satellite technology have revolutionized the agricultural sector. With the advent of multispectral and hyperspectral satellite imagery, farmers now have access to unprecedented levels of detail about their crops and land. These satellites provide comprehensive data on various wavelengths, enabling farmers to monitor crop health, detect diseases, and optimize irrigation strategies with remarkable precision. Governments and organizations around the world are increasingly leveraging these capabilities to improve food security and enhance agricultural sustainability. The integration of agriculture satellites into farming practices has not only increased productivity but also contributed to more efficient resource utilization and environmental stewardship.
Sedat BAKICI